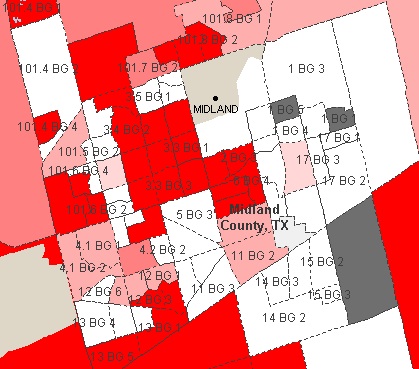
I realized that my last two posts on black/white segregation in Texas focused on data from the large urban centers of the state. I don’t mean to imply this is not a statewide phenomenon. As a follow-up, I’ve pulled maps from Remapping Debate’s data tool for a couple of small and mid-sized cities in the state.
First, Marshall Texas, the subject of Bill Moyer’s 1983 documentary on race relations and a culture of segregation in what was his own hometown. As before, areas shaded in red are estimated to have less than 3% African-American population, areas shaded in black have greater than 50% African American population.* Here the data shows an east-west divide along racial lines.

Second, Beaumont, Texas, where the Neches River draws a clear boundary between the majority African-American and near-exclusively white regions of the greater metropolitan area.

Lastly, Amarillo and Midland, which both have 3-4 distinct block groups that are majority African American in an otherwise majority-white city.


These maps demonstrate that ongoing segregation in Texas is not restricted to the large metropolitan areas.
Remember, you can make your own map using Remapping Debate’s data tool here.
Note: * while Remapping Debate doesn’t provide margins of error, ACS block group data should be considered to have at minimum a 1-2% margin of error on population estimates.


